
explai delivers powerful analysis with minimal effort. This article shows how you can extract statistically validated insights from a table of 1,800 smartphones with just a few sentences. Feel free to follow along with these steps in our free test system. You'll see the user inputs highlighted in blue.
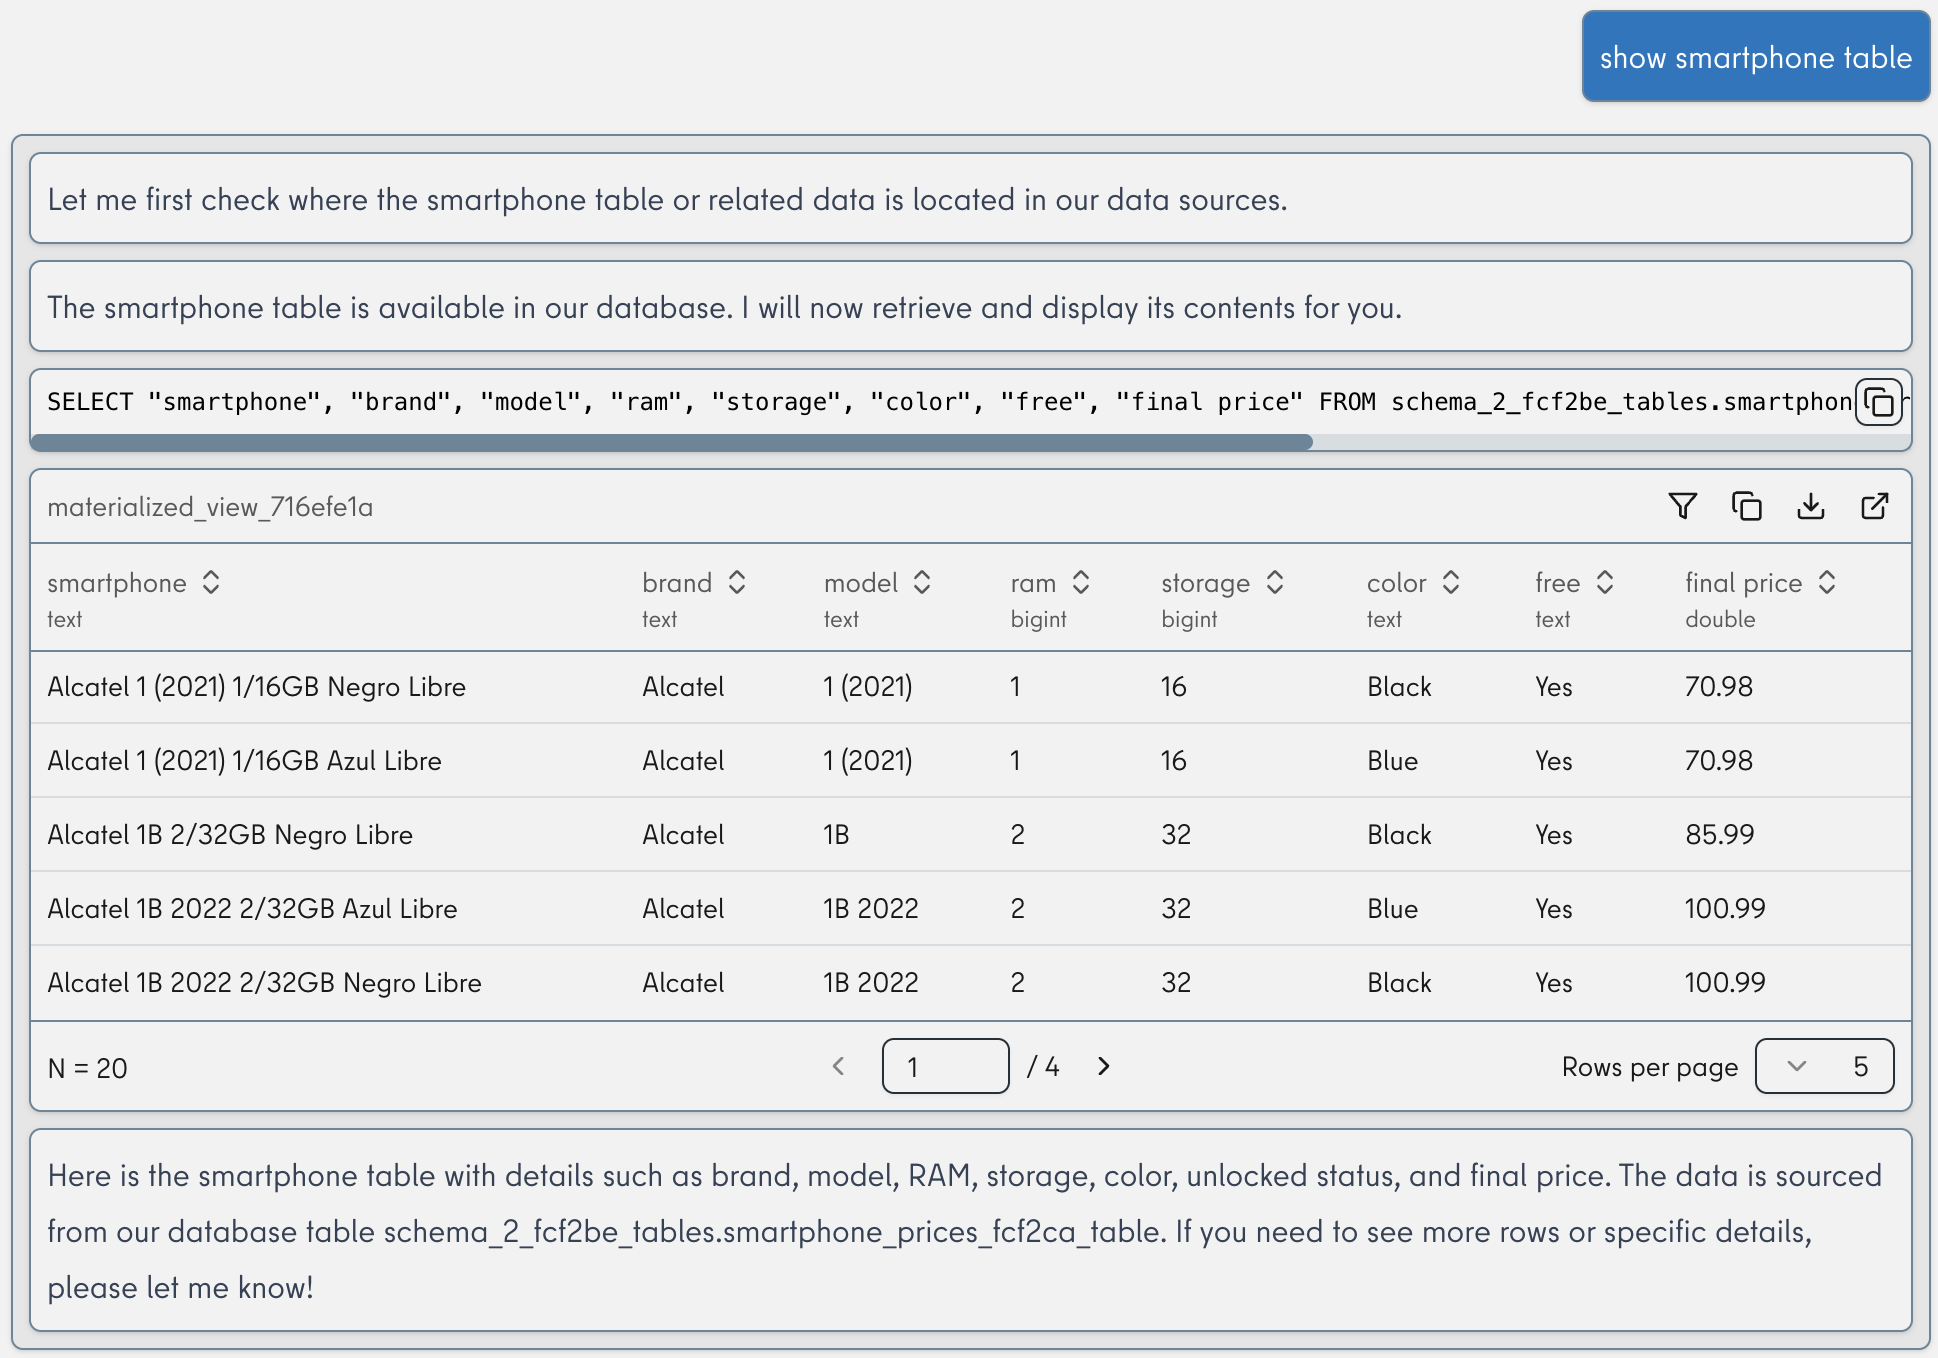
Where do I find the table — what was it called again?
We uploaded our example via file, but it could just as easily come from your database or a third-party system. Or you can simply create new data, for example for what-if analyses or to test something a colleague has taught explai:
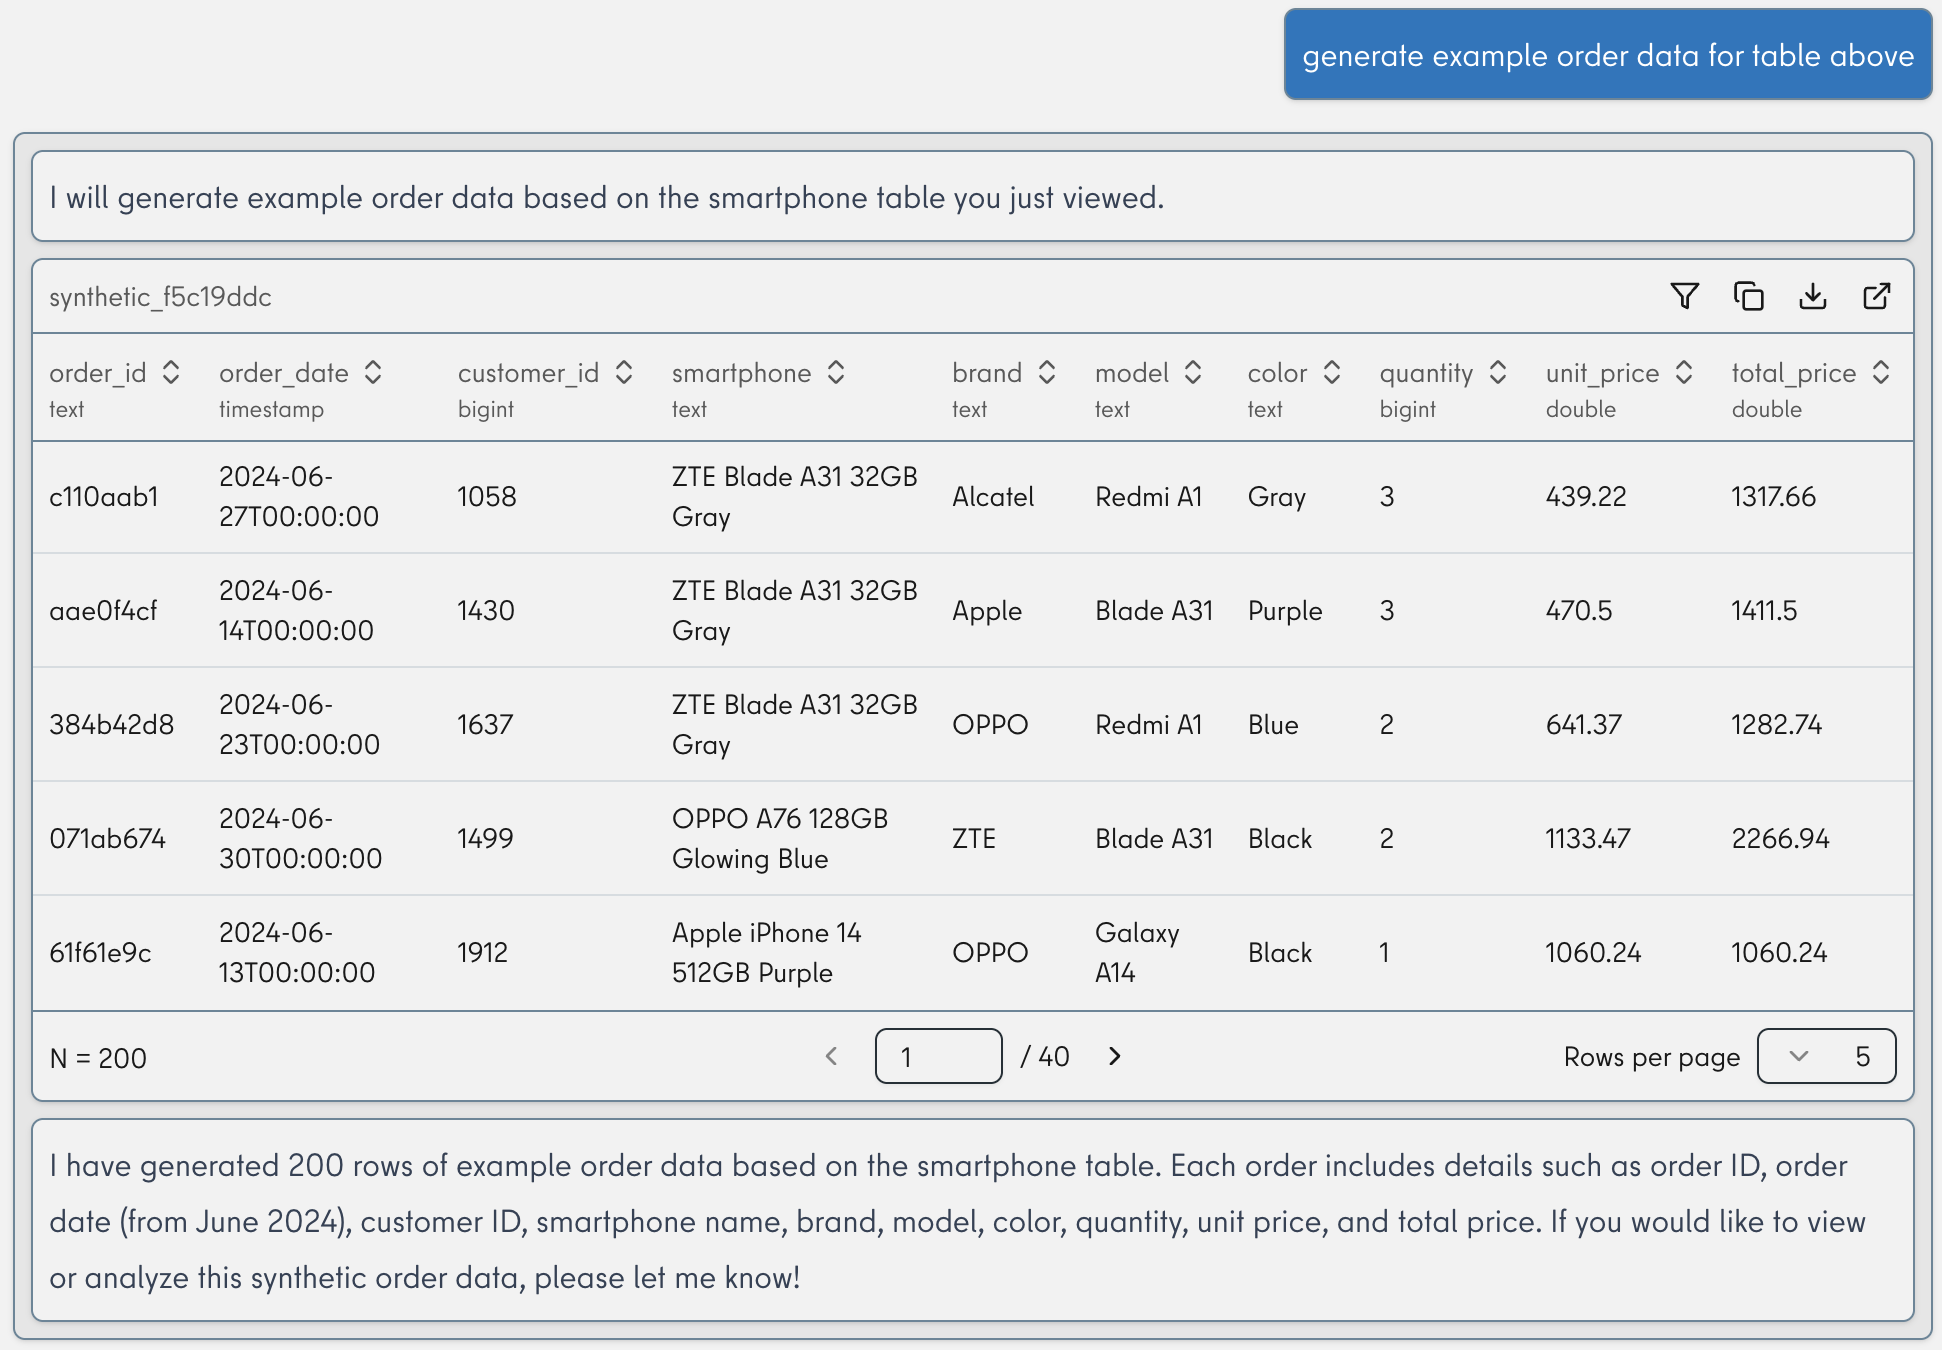
explai seamlessly combines multiple tables and uncovers data errors:
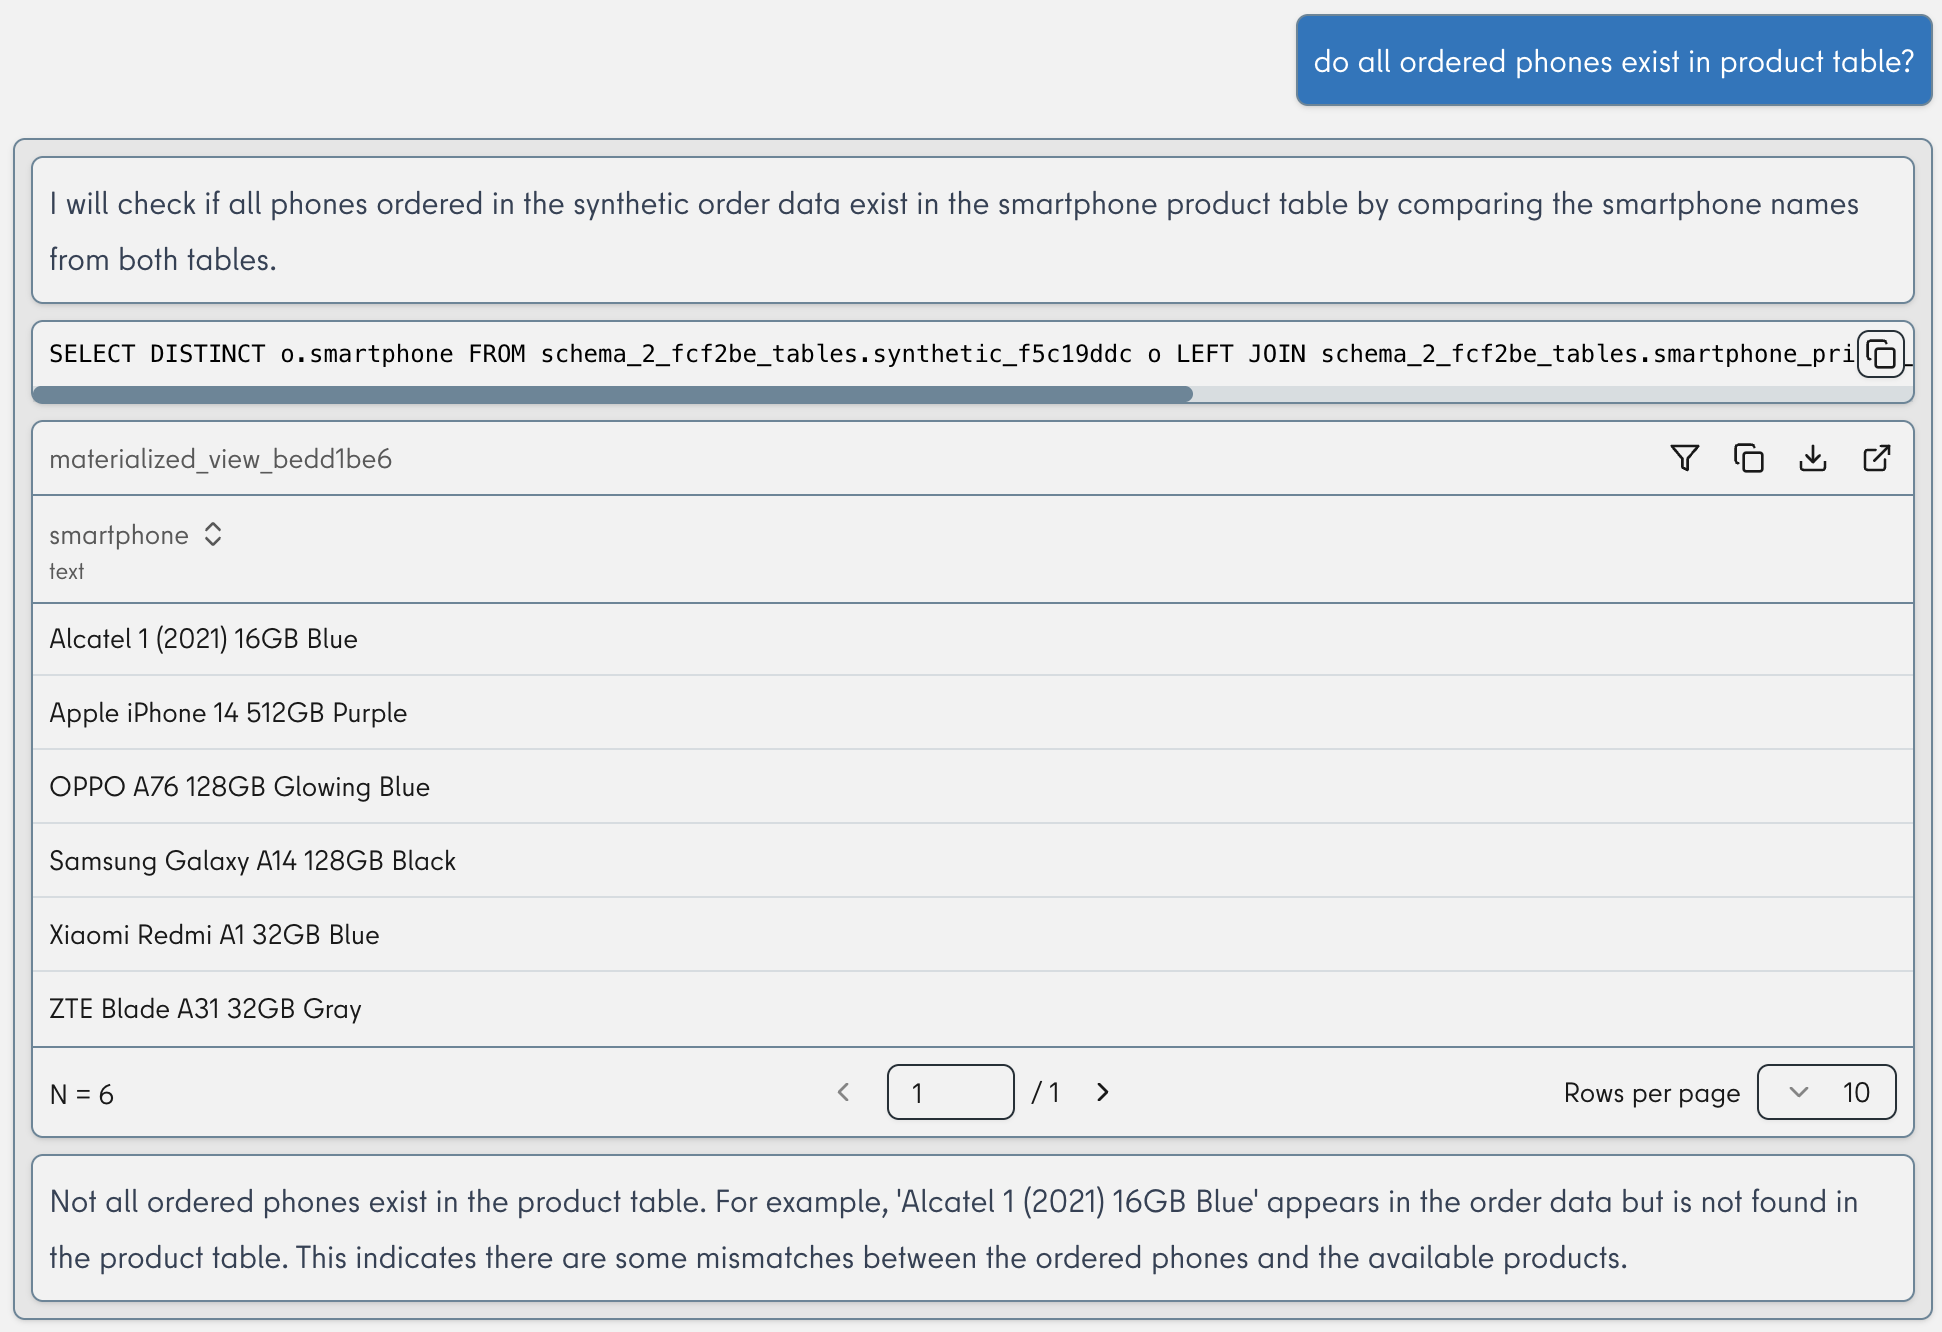
Improving data, avoiding misunderstandings
explai also solves many other data problems and transforms raw data into a format suitable for your needs. Since you can export all the data you see with a single click, this alone can save significant time.
explai avoids technical jargon and offers a bouquet of connection points through transparent intermediate results. Appetite comes with eating analyzing, but the decision remains yours: More time for other things — or finally get to the bottom of a hunch.
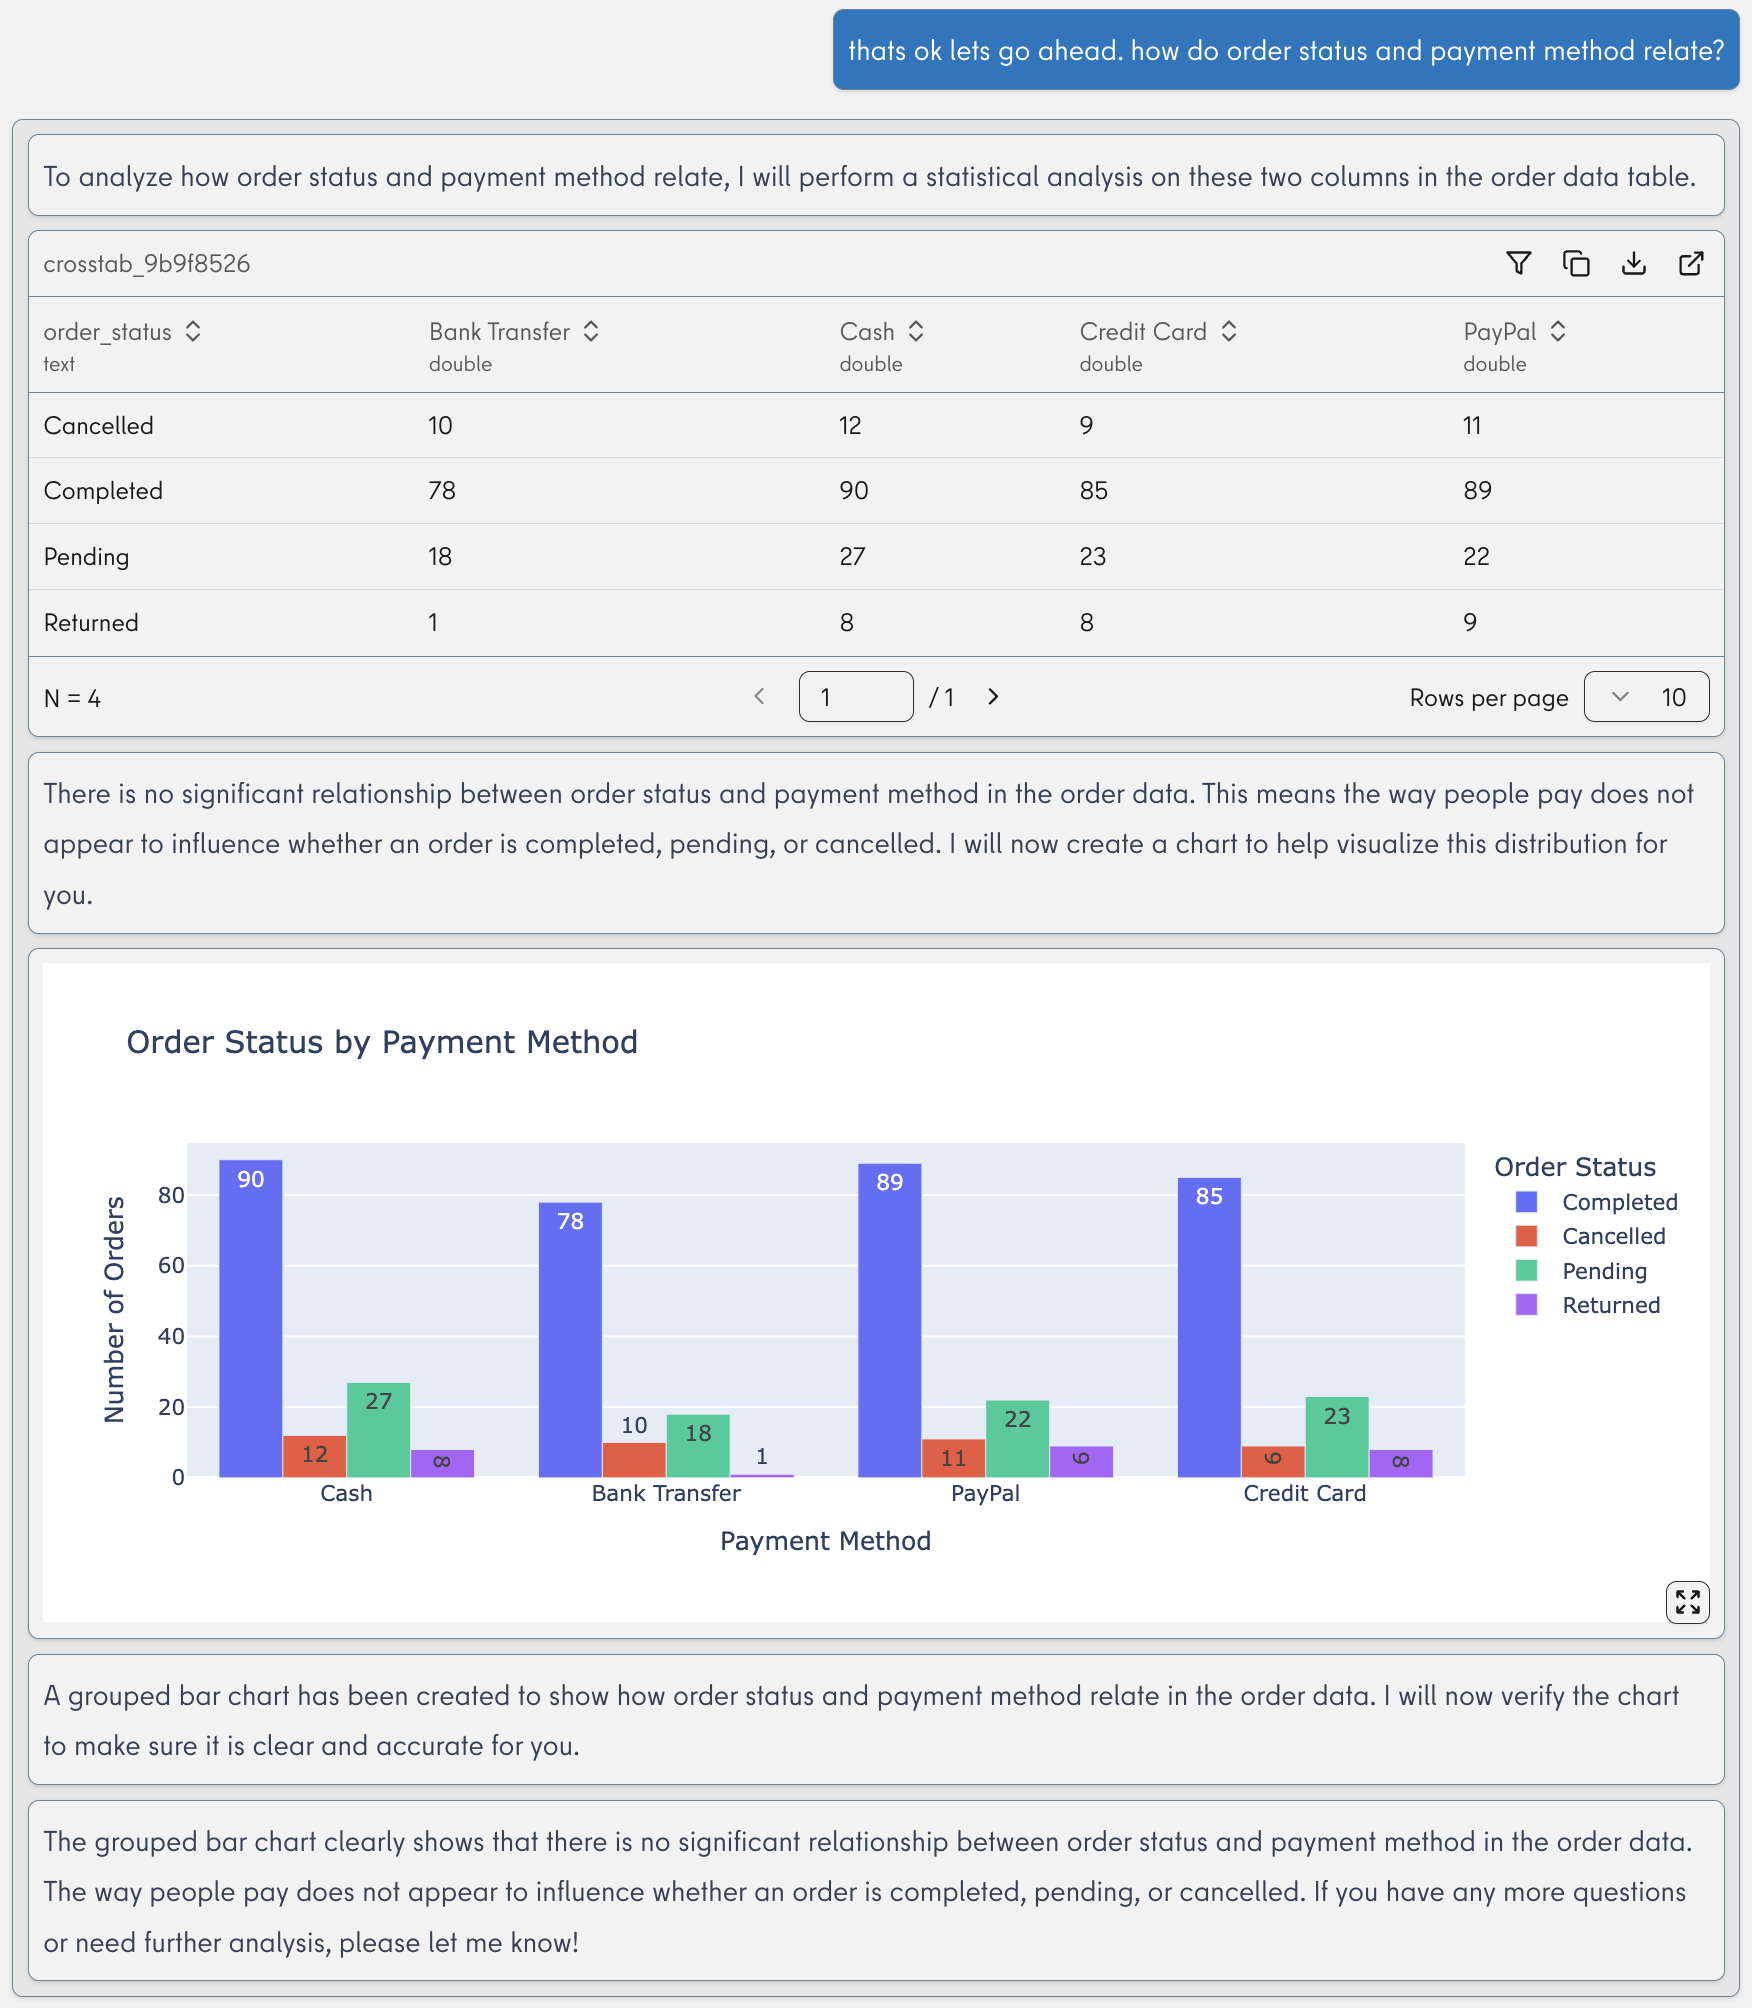
Even in our toy example, there's potential for misunderstandings. Above you see a crosstab of four payment methods and four order statuses. It's hard for humans not to see patterns in 16 numbers. A colleague from customer service notices that orders via bank transfer rarely get returned. Should we perhaps change the default payment method in the online shop? That's when the sales colleague sees red: Who knows how that would affect the order rate!
explai would know that too 😉, but already told us above that we can skip this question because "there is no significant relationship between order status and payment method."
But is that right? We're working on making explai transparently explain its methodology and make you smarter with data even outside of software. Until we get there, let's briefly peek under the hood at the agentic machinery:
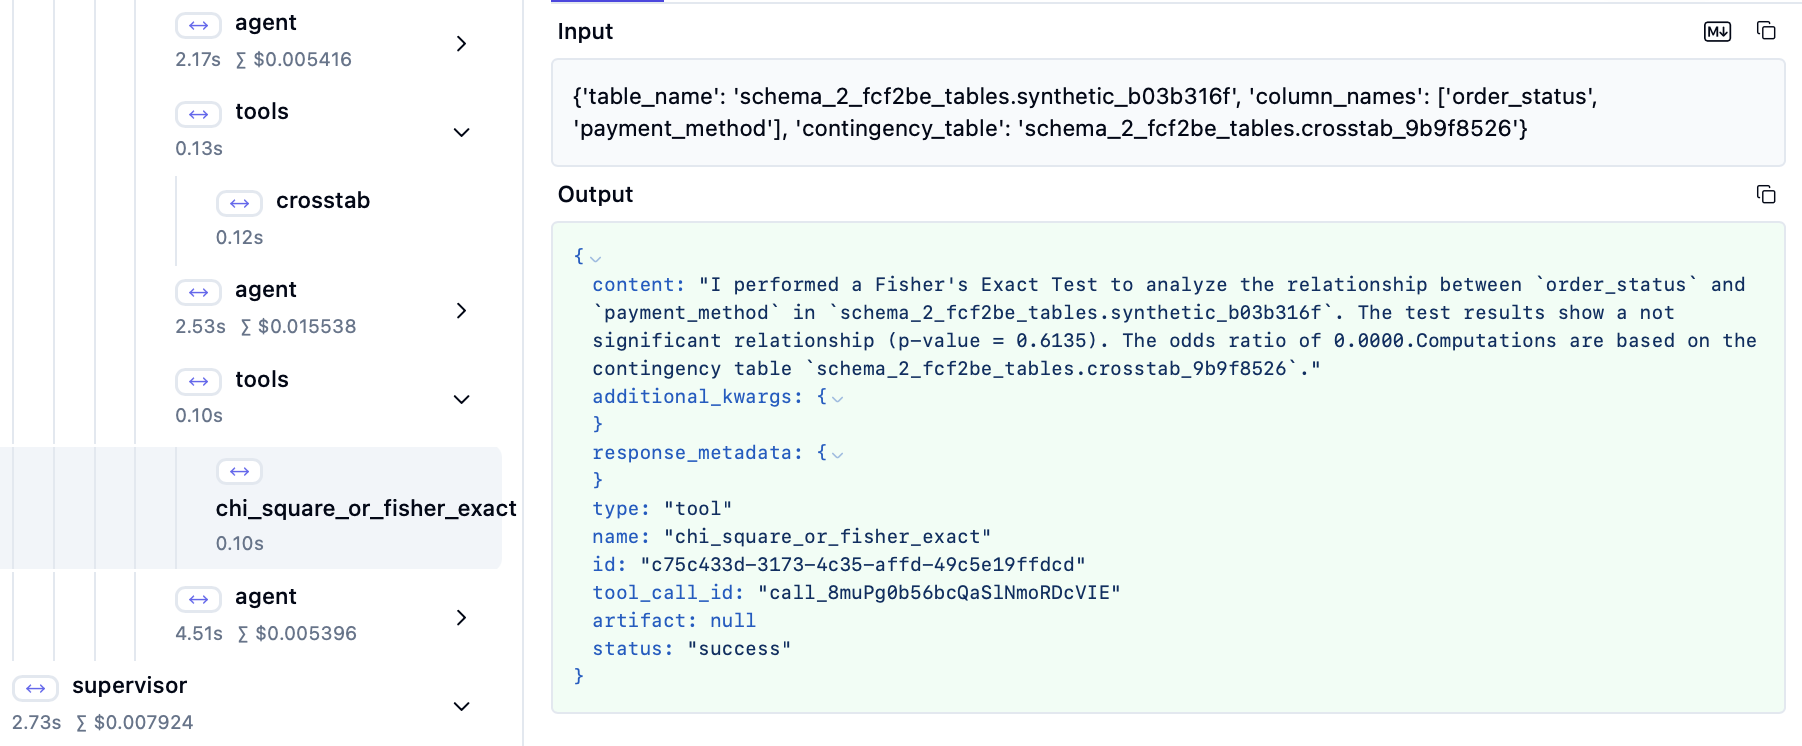
You can see here a small excerpt of the dozens (sometimes hundreds) of work steps that explai agents (yes, that's right, we have a whole team with different specializations) execute in the background for each question. In the top left, you can see which tools explai selects here for comparing two categorical (non-numeric) columns. On the top right are the parameters that the agent independently passes. One of them is the table with pairwise frequencies (crosstab). Where does it come from? Here we see how an agent-based platform gives wings to the long-held dream of "expert systems."
Our agents plan from the end: explai understands that the user is asking about a correlation. Unlike the ChatGPTs of this world, it may only answer based on data (AI-speak: "grounded"), without having direct access to the raw data itself. It must use our curated libraries (the same ones that human professional data teams work with), and we invest heavily in ensuring they do this competently ("Best Practice"). In the tension between previous conversation, your company data, tools, process knowledge, and personalization, explai navigates through a mixture of forward-looking planning and data-driven iteration toward an answer.
Here in the call tree on the left side, it first calls the crosstab tool. It shows the result to the user and passes a reference to the crosstab as input to the statistical test for checking the correlation. This function itself also possesses intelligence. The ultimately executed procedure best fits the small frequencies present here. None of this is programmed as hard logic; rather, the art (ours) consists of creating an effective working environment for the agent. (Admit it, you've also baked a birthday cake for that colleague who's so good with Excel.)
Here in the example, the preparation consists of a single step, but in practice, "massaging" the data, checking all method prerequisites, and model criticism can take many hours — and that's for just one analysis path.
Hetero-what?
Every analysis is just one perspective, and there's much more to discover:
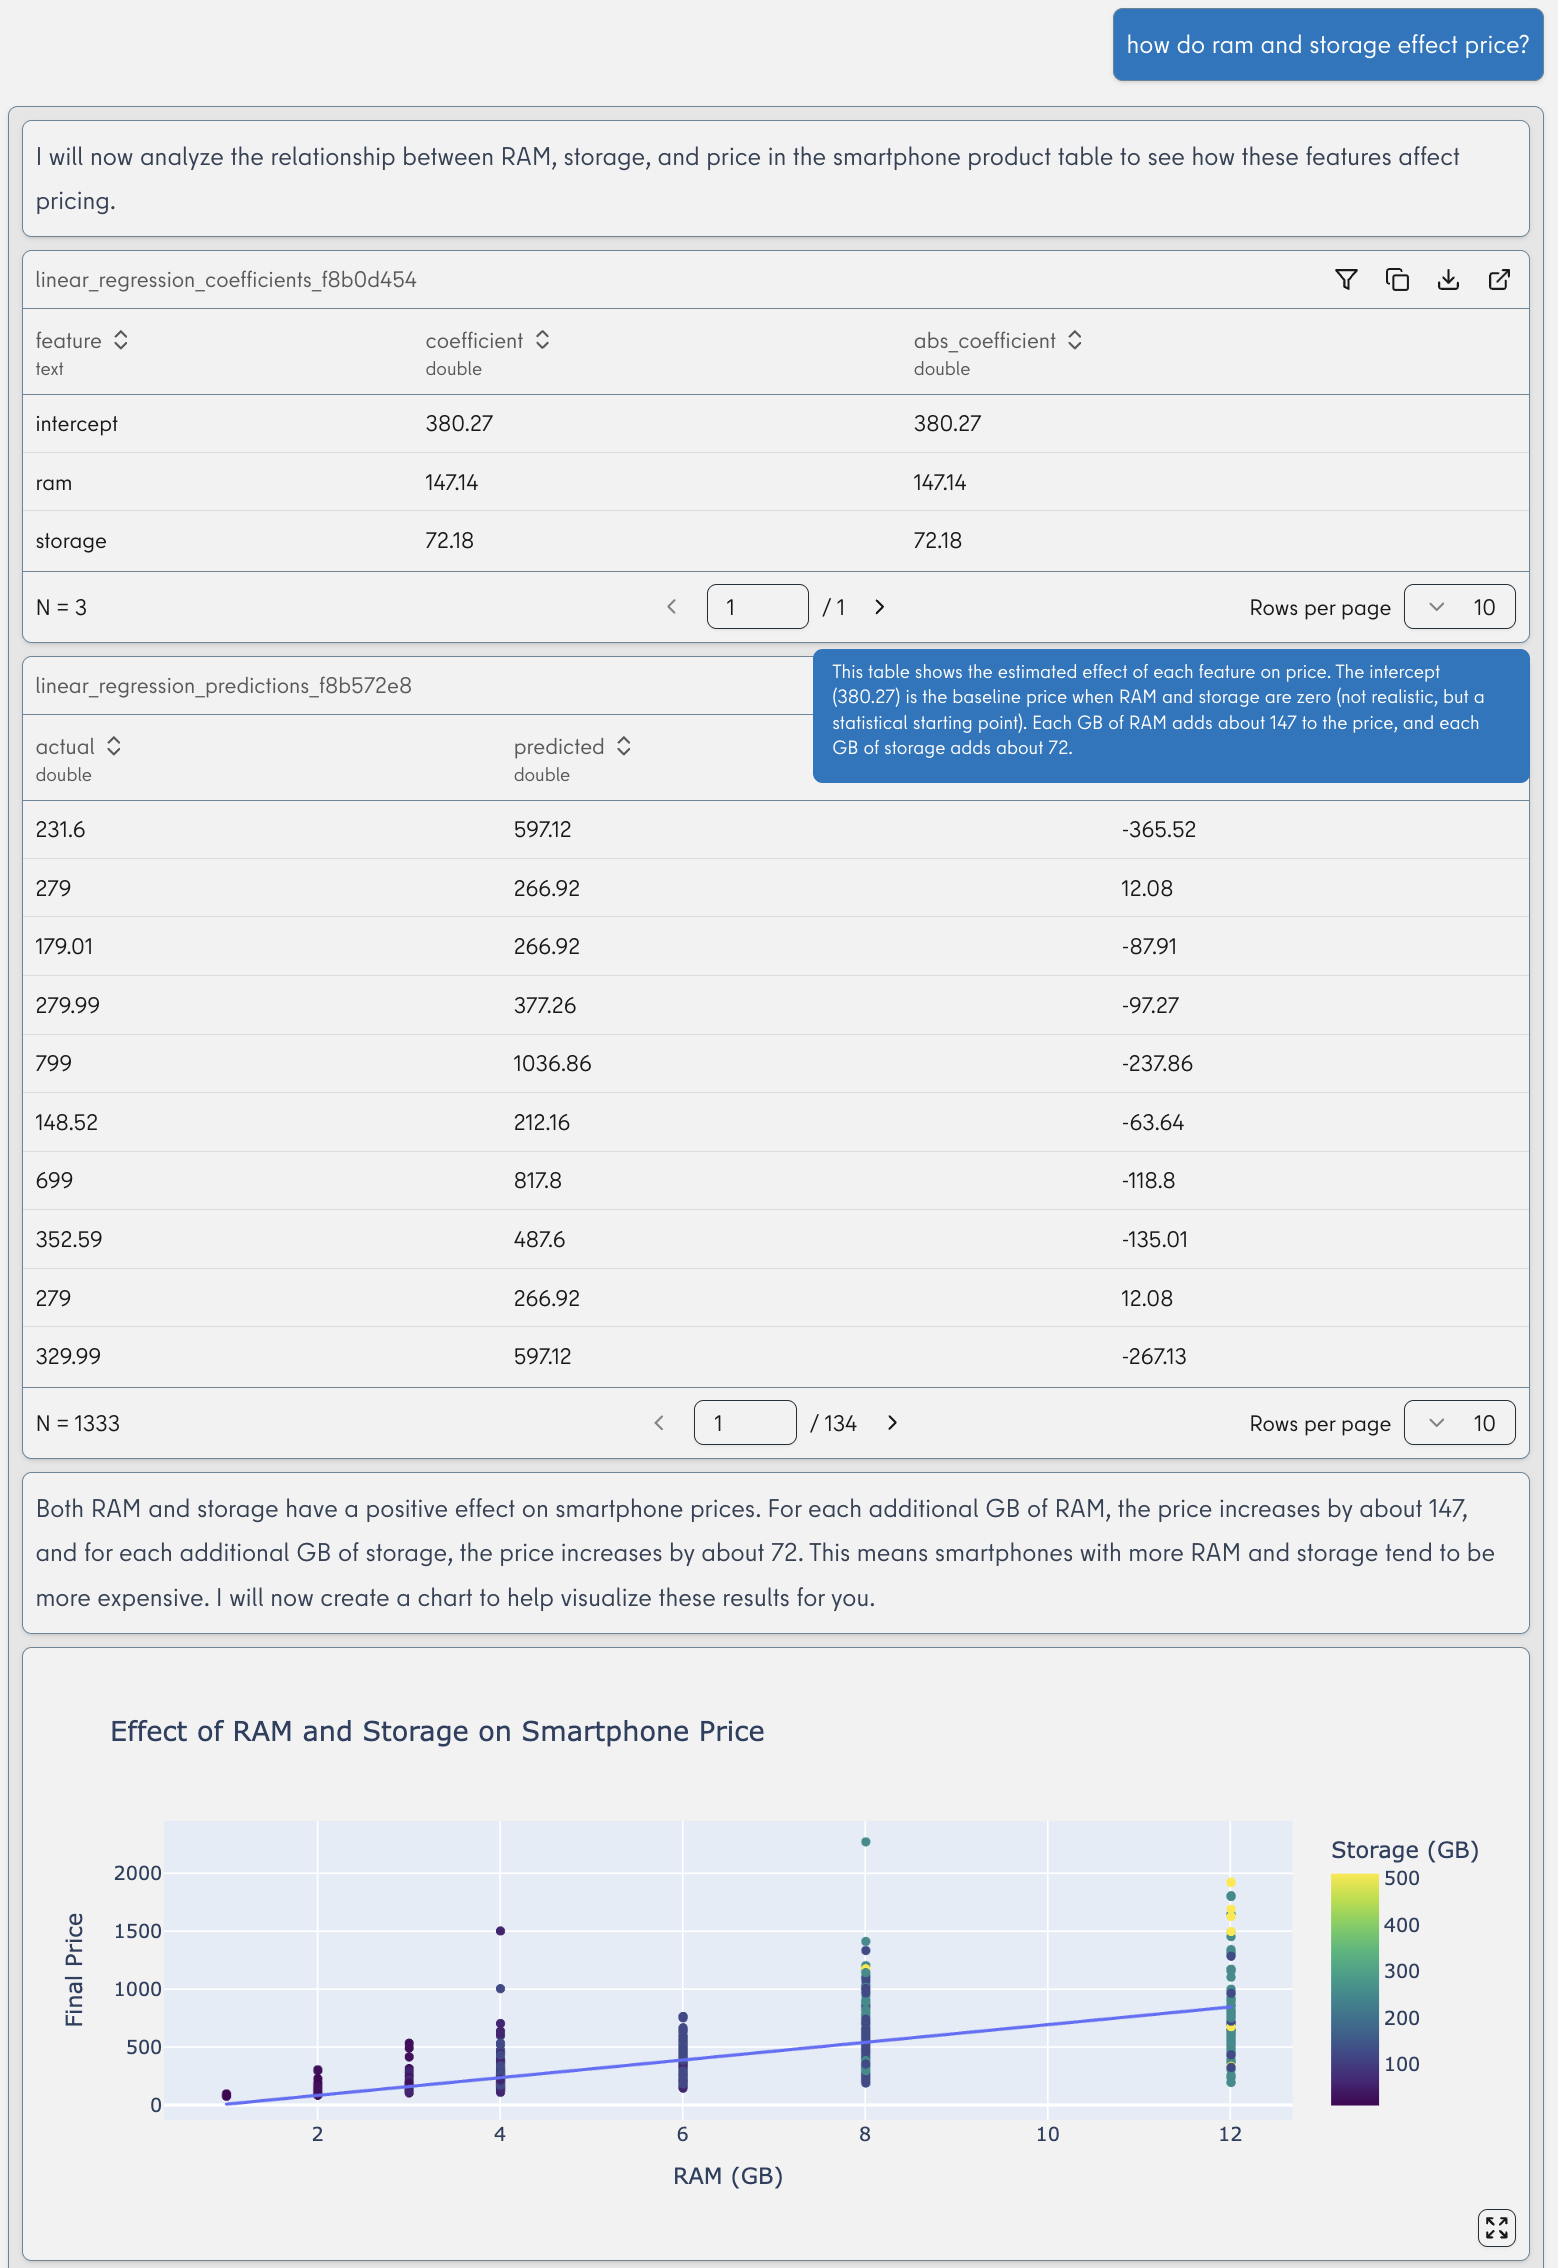
Seven words and you get a complete Linear Regression. You can also do this with Excel or a programming language like Python, R, or SAS. But only if you can pronounce and define heteroskedasticity without errors is it as watertight as with explai. A general-purpose tool like Excel can't do too little here (okay, that too), but too much: With enough clicks, you can combine anything with everything, without guidance or guarantee that it still makes sense.
In the result above, you see the determined model (the coefficients), predictions, and the visualization of an example variable. The blue box with smaller text appears when you hover over tables and graphs. Here the agent supplements the results with interpretation aids.
As expected, the price of a smartphone can only be imprecisely predicted based on its storage. Let's indulge in a second query (phew, time for a coffee break):
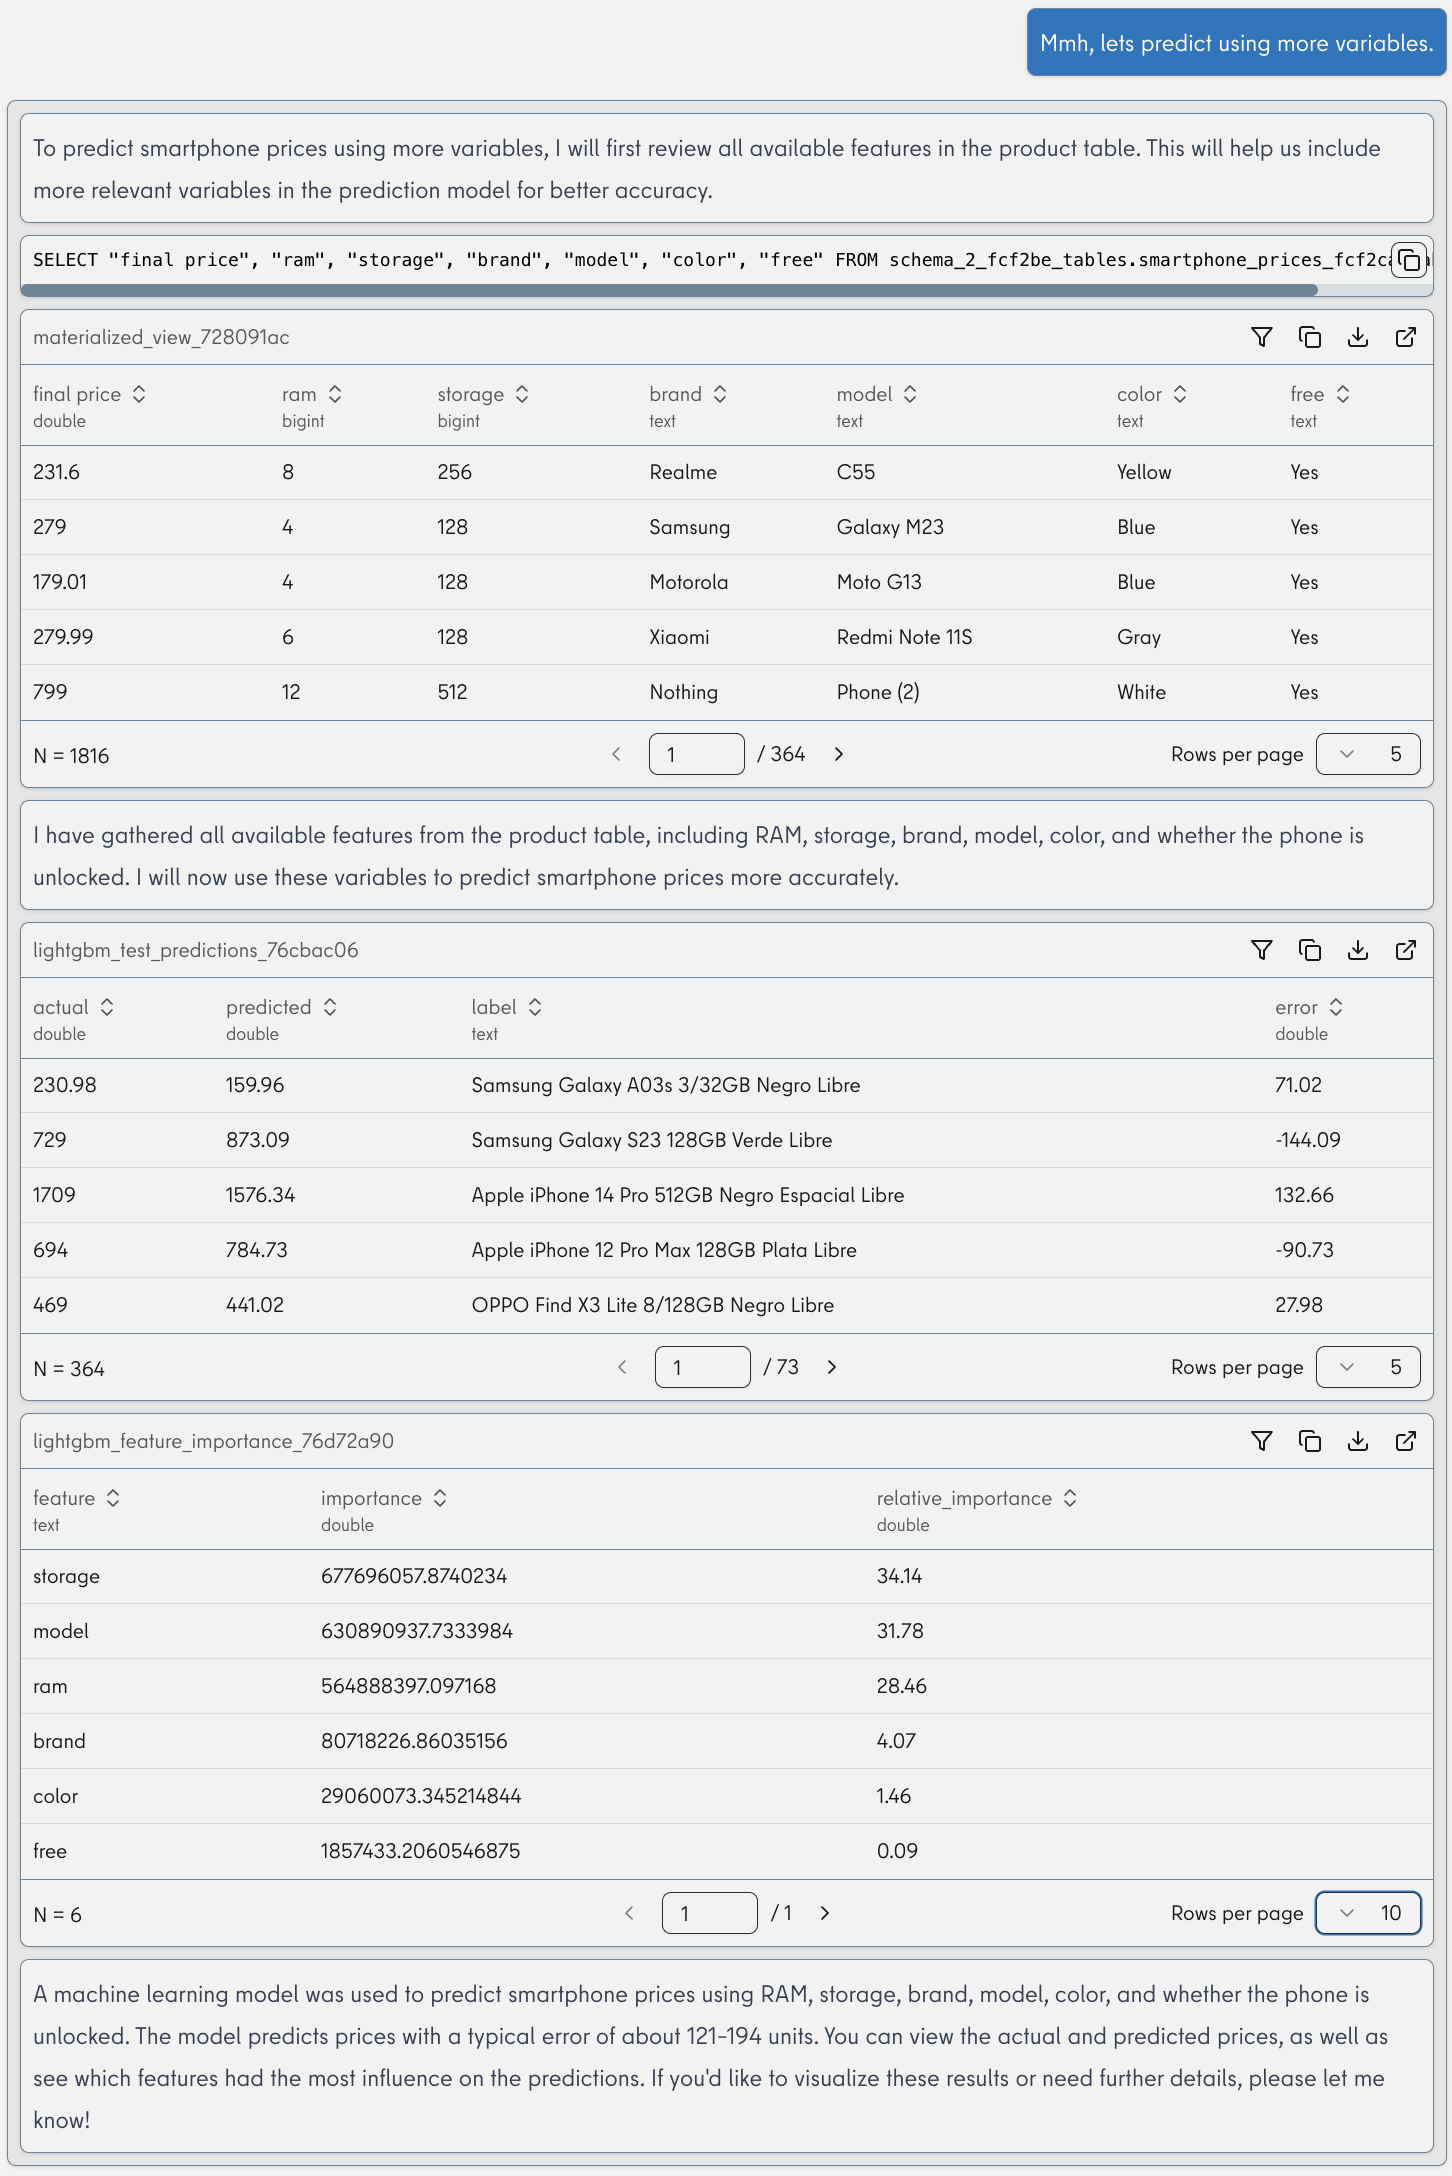
Like a human analyst, explai takes another look at the data. It selects only columns that make sense for a price prediction, thus leaving out the name column.
After the classical regression of the previous answer, explai this time decides on a modern Machine Learning method. This makes sense, because for columns with many values like Color and Brand, regression often doesn't perform well. The algorithm chosen here is a trusted partner of many Data Scientists, freely available, and a frequent winner in competitions. With explai, you get access to the same modern libraries as experts, even without programming knowledge.
The last table shows which features have a particularly high influence on price. Because Model shares its effect with Brand, Storage comes first.
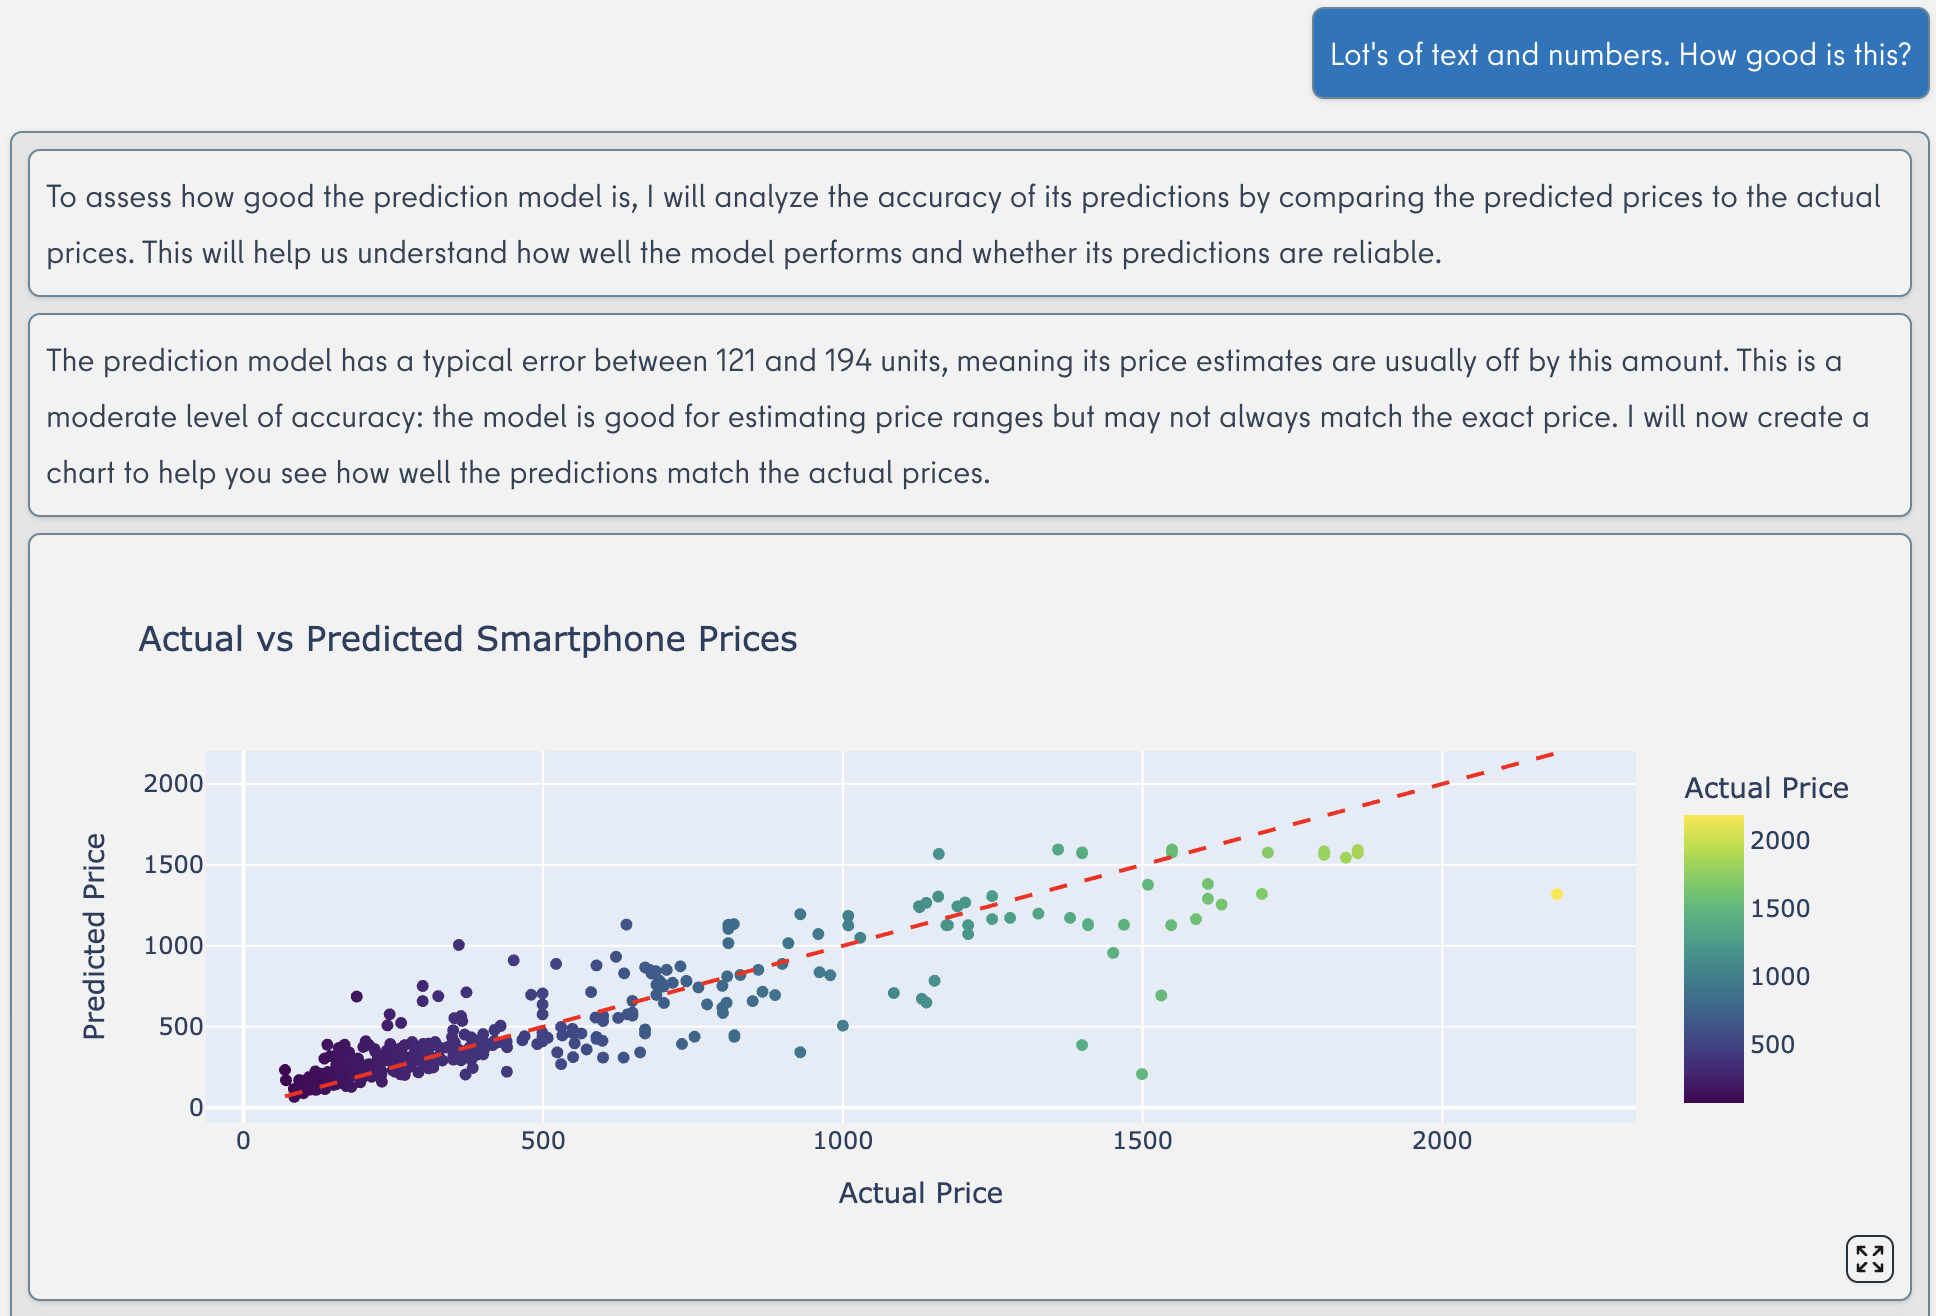
explai helps you understand results better at any time:
Results for the Busy
Since our team is international despite being headquartered in Berlin and develops for companies throughout Europe, our example so far has been in English. But explai not only builds bridges between "business speak" and "tech jargon" but also speaks your language:
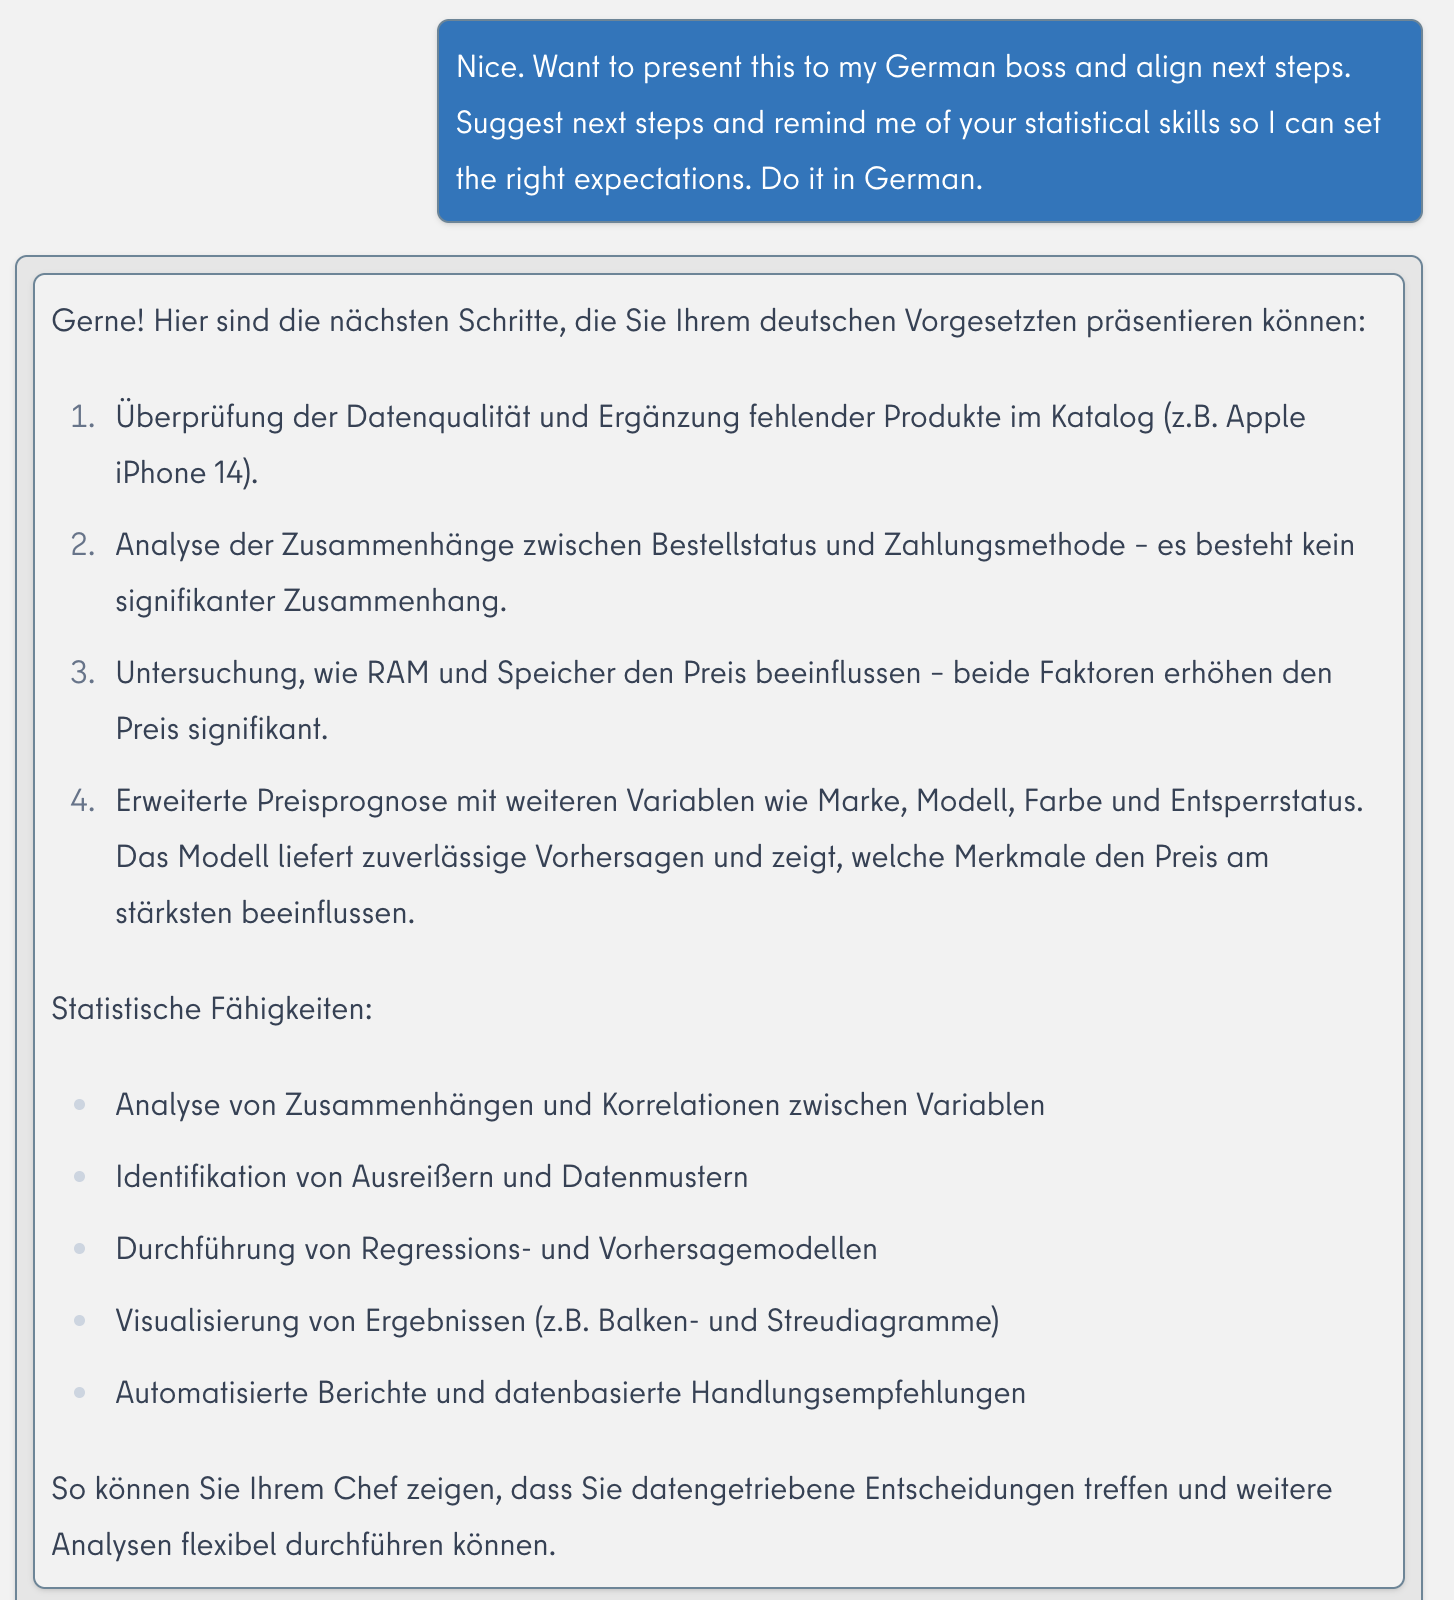
Suggestion to save time after this long article: Skip the meeting with your boss entirely and share your analysis with one click. Let explai deal with your boss's time-consuming follow-up questions!
Test Us
We still have a lot planned: The repertoire of Open Source analysis methods is inexhaustible and Data Science is a broad field with lots of experiential knowledge. Disciplines like time series analysis are currently being disrupted by Deep Learning, and we can't wait to give our agents access.
But above all, we want to learn which information our users really value and understand in order to become more uncomplicated, exciting, and relevant. For this, we need your help. Contact us today or secure a free access to our test system.