Home

Getting Started

See All Posts

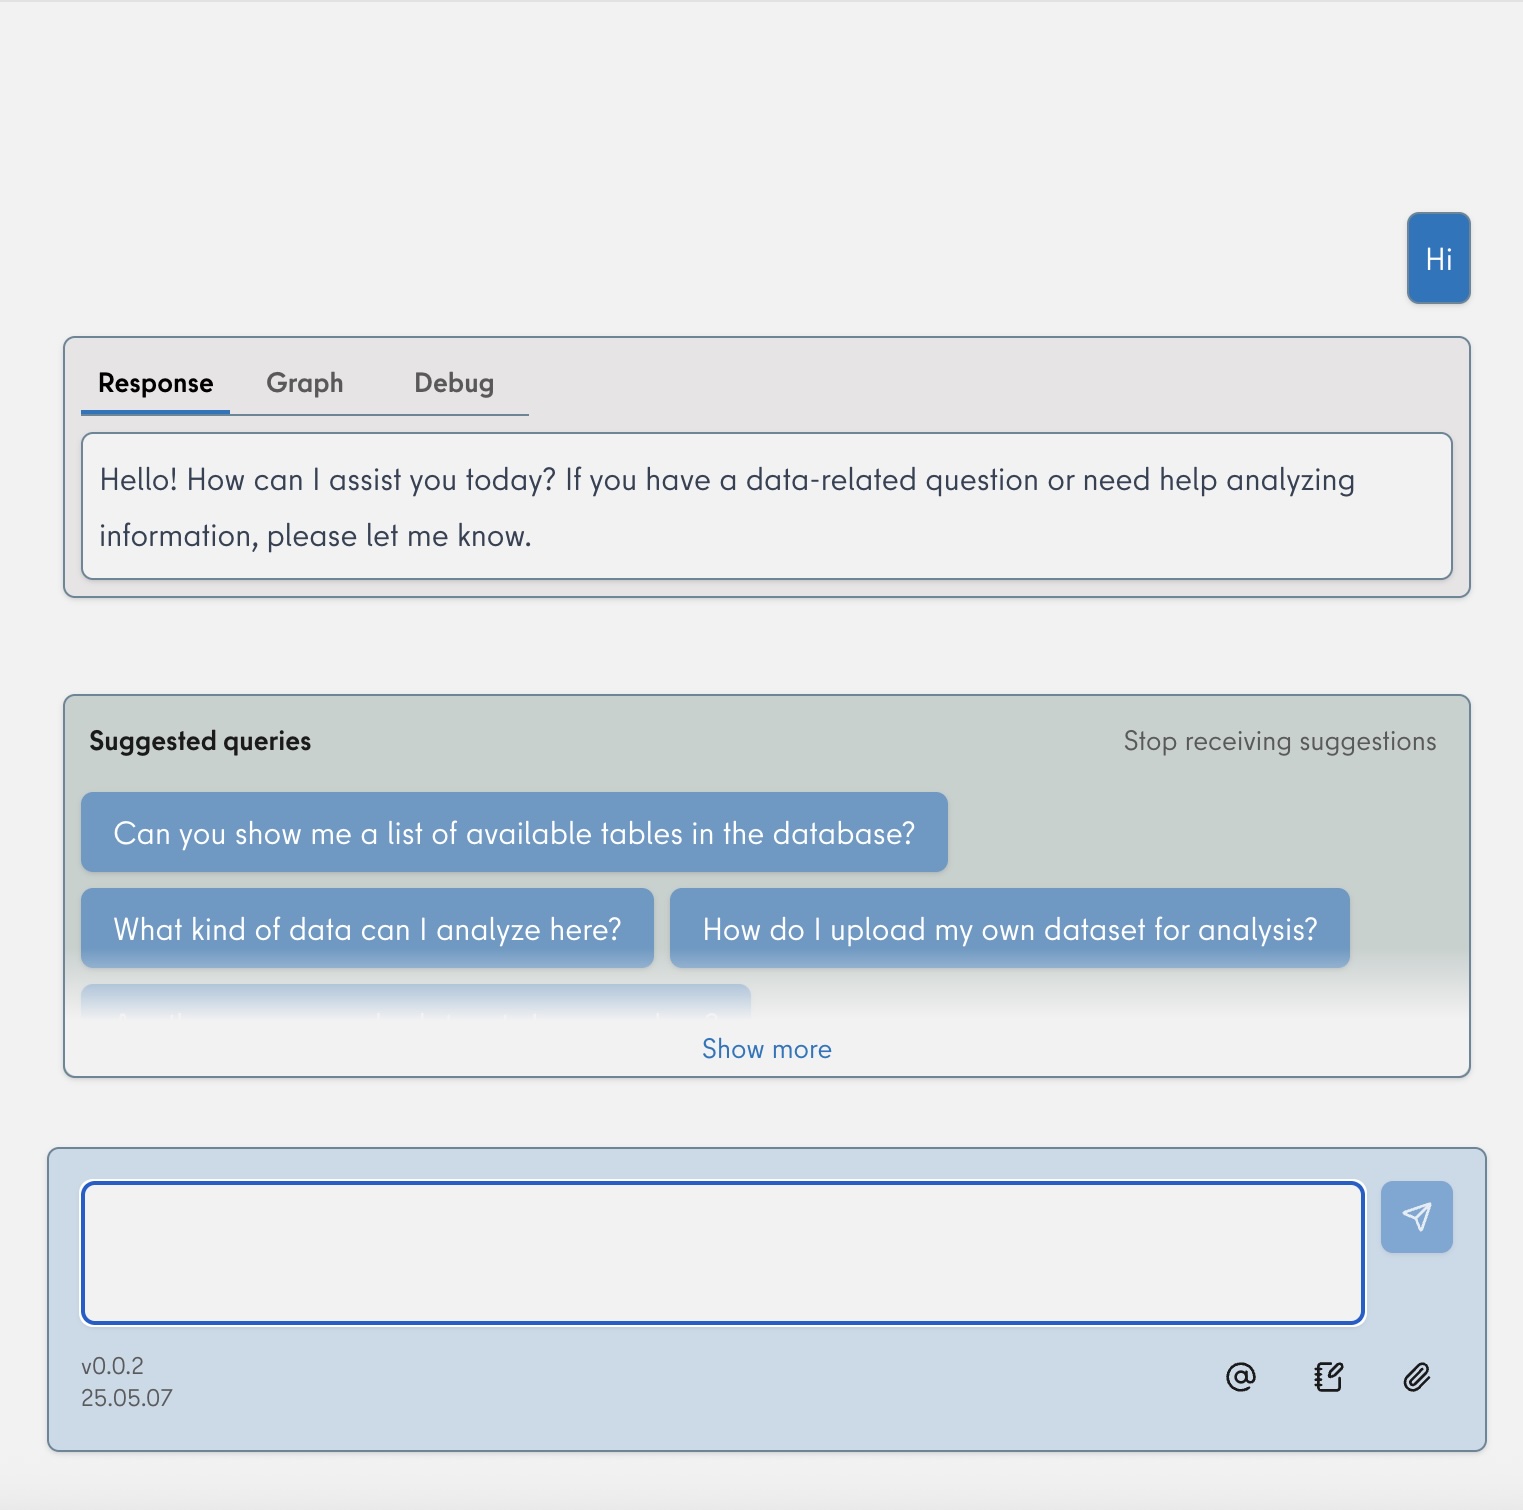
In this post, we're excited to share that you can now explore our user interface, create projects and notebooks, upload data, edit and customize metadata, and take advantage of many other features designed to support and streamline your daily work.

Projects & Notebooks: This demo introduces explai’s interface, showing how to access projects and notebooks via the left sidebar. It features different projects each with associated notebooks. Data uploaded to a notebook is shared across notebooks within the same project but not across different projects. .
Create Projects & Notebooks: In explai UI, you can create a new project by clicking the folder icon with a plus sign. Right-click to rename it and view the timestamp. You can then add notebooks like “pre-processing” and “statistical analysis,” naming them as needed. Notebooks can be added gradually within each project.
Upload Data: In explai UI, you can upload data to a project using the "Upload File" icon within any notebook. Uploaded data is shared across all notebooks in the same project. For example, in a healthcare project, diabetes data is uploaded and automatically analyzed, generating metadata like schema, column names, and data types.
Update Metadata: This demo shows how to edit agent-generated metadata by enabling editing from the window's top or bottom. Users can modify fields like names, descriptions, and data types, while schema and table names remain fixed. After making changes, submitting updates the table for future analysis.
Set Rules in Metadata: This demo shows how to add rules to metadata in explai-UI. By editing a column like BMI, you can set conditions—e.g., use only values above 20. These rules affect future queries. The agent adapts SQL generation accordingly, streamlining analysis without repeating conditions.
Follow Suggestions: This demo shows how explai agent suggests queries based on user input and how to enable or disable suggestion boxes. The agent generates relevant follow-up questions to explore data further. Users can interact with these suggestions to quickly navigate and analyze their data.

Are there additional features you'd like to see? Would you like to experience explai with your own data? We’d love to hear from you.